

Revised 10/27/2025
Creating Personal Dashboards in akoyaGO
A dashboard in Microsoft Dynamics 365 is a visual interface that provides a real-time overview of key data and activities relevant to your role. Think of it as your personalized command center.
Dashboards can be customized to individual users (Personal Dashboards) or available to all users in akoyaGO by default (System Dashboards.) One of the biggest benefits of dashboards is that they can bring together views/charts from different tables within akoyaGO in one screen. These dashboards can also be referred to as “Homepages.”
This Knowledge Article walks you through creating a dashboard specifically in akoyaGO, but more information on dashboards and Microsoft functionality can be found here Microsoft Learn - Dashboards
STEP 1: CHOOSE THE area
Before creating a new Personal Dashboard, choose which area you want to create a dashboard within. The default dashboard will change depending on which area you are in.
Click on the +New button, then select Dynamics 365 Dashboard.
Choose a layout
The different layouts determine the number of rows and columns of components. A new window will open once you click Create.
(Note: Once you choose a layout, you cannot change it unless you create a whole new dashboard.)
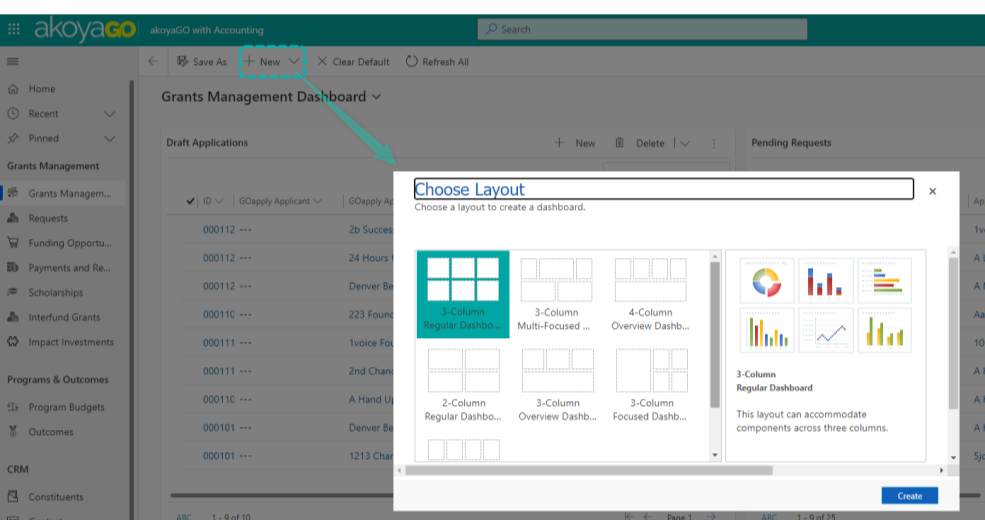
Choose the layout that makes the most sense for the components you plan to include. For example, if you are inserting CHARTS, you may opt for narrower columns. If you are inserting LISTS (aka Views), you may want to select a layout with wider columns, so you can see more columns within the view.
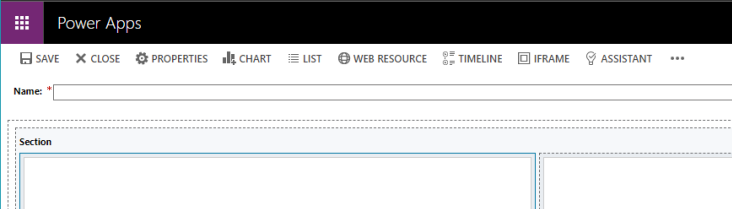
STEP 2: INSERTING COMPONENTS
There are six different components: Chart, List, Web Resource, Timeline, Iframe, and Assistant. The components that are used most frequently in akoyaGO dashboards are Charts and Lists (aka Views.)
- Chart creates a chart based on data from a chosen view of a record type.
- List creates a view also based on data from a chosen view of a record type.
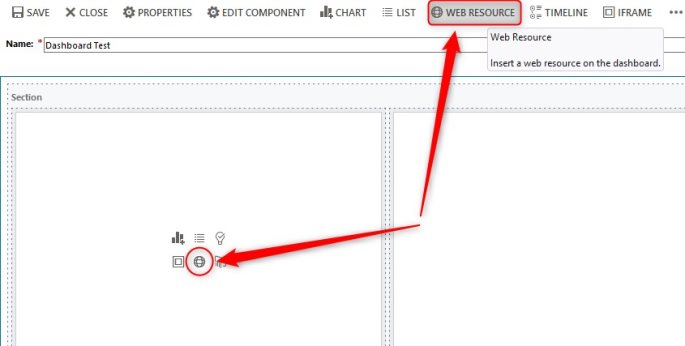
- Web Resource allows you to link a virtual file stored in the system, which you can then access with a single click on the dashboard.
- Timeline creates a timeline of all the related activities of a specific table, such as tasks, appointments, calls, emails, note, etc.
- Iframe allows you to link a URL that also links to another Iframe. If the Iframe communication is enabled on both ends, then you can access that link with a single click on the dashboard.
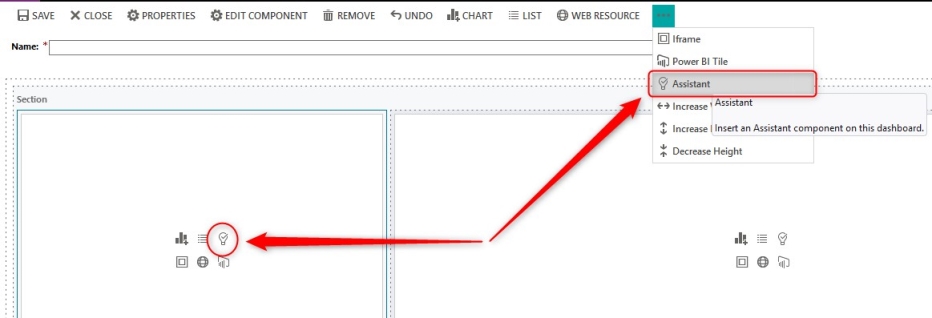
- Assistant uses actionable insight cards to help sellers track daily actions and communications. This component is only available for users with the Dynamics 365 Sales Enterprise license.
IMPORTANT - All components must exist before creating your dashboard. If you need to create any Personal Views or Charts, or System Views or Charts - do so before creating your dashboard.
Insert a Chart
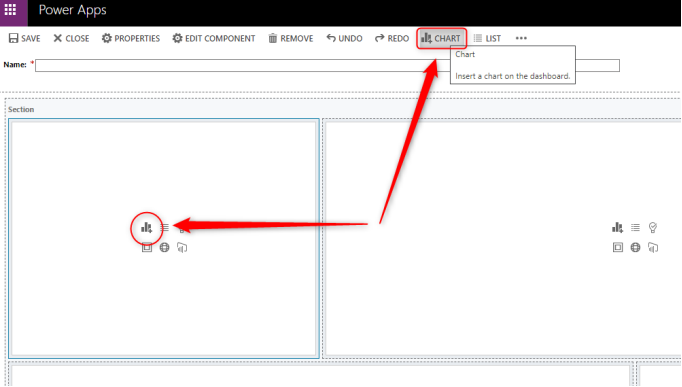
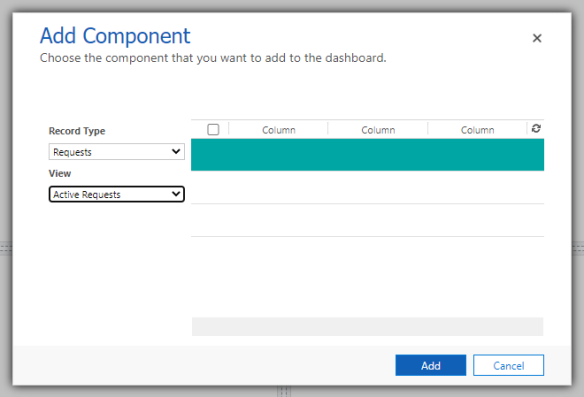
Choose the Record Type (aka Table), View, and Chart, and then click Add to add it in the dashboard.

Choose the Record Type (aka table) and View, and then click Add to add it to the dashboard. (Note: You will not see any data in the list while you’re editing the dashboard.)
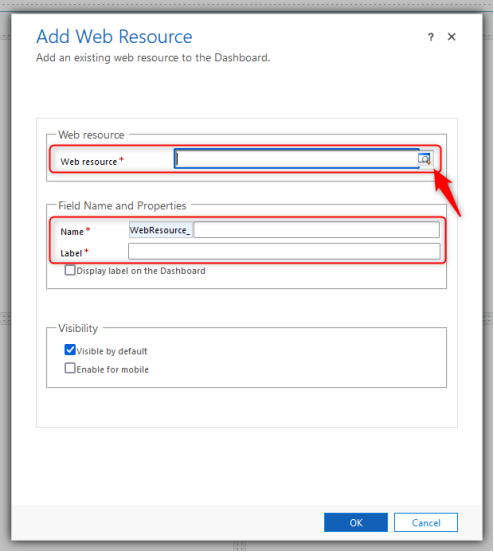
Choose the Web resource, add a Name and Label, and then click OK to add it to the dashboard.
The Label will always display on the dashboard when editing, and if the “Visible by Default” box is selected, it will also display on the saved dashboard.
Note: You cannot change the Name of a Web Resource once it is created, but you can edit the Label.
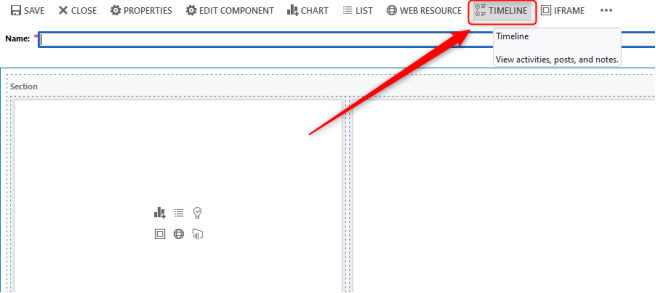
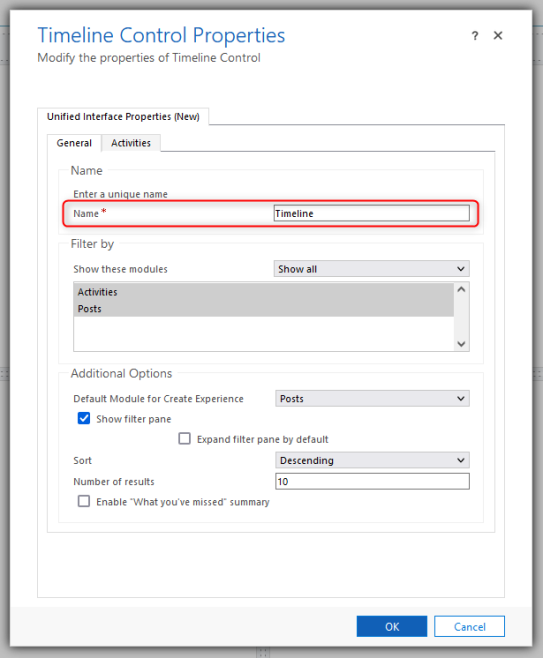
Choose a Name, any desired filters, and click OK to add it to the dashboard. Since there is no icon in the components to add this, the timeline will be added to the bottom of the dashboard.
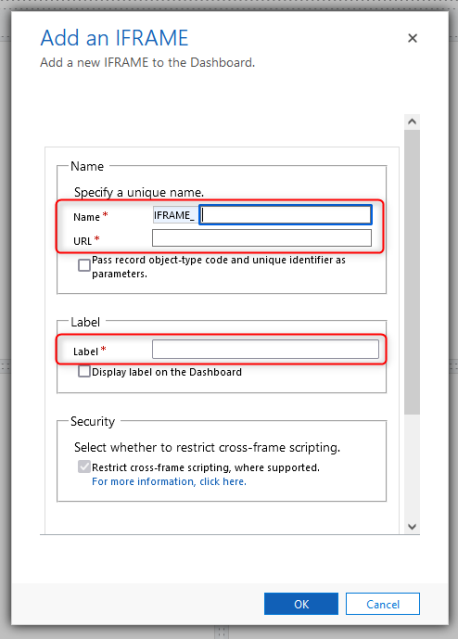
Choose a Name and Label, add the URL, and select OK to add it to the dashboard.
STEP 3: CUSTOMIZING THE DASHBOARD LAYOUT
To move a component, bring your cursor to the top blue header of the component. Hold a left click, then drag and drop to a different space. A red line will appear at the top of a space if you drag the component over that space. (Note: This part may be difficult, so try to move slowly.)
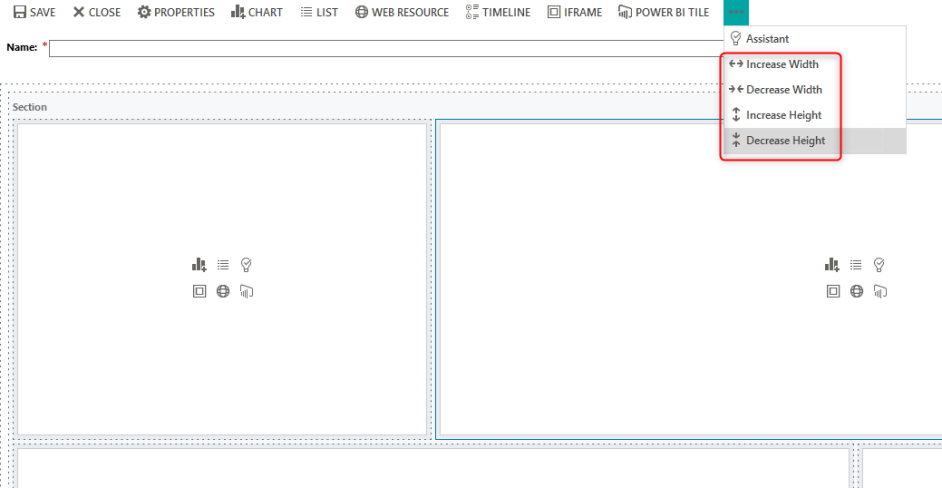
To change the size of a component, select a component, click the three dots on the upper menu, and choose Increase Width, Decrease Width, Increase Height, or Decrease Height.
If a component is the smallest width, then there won’t be an option to Decrease Width.
After moving the components and you are finished customizing the Dashboard, make sure to press Save in the upper left-hand corner before closing
EDIT AN EXISTING personal DASHBOARD
To edit a Personal Dashboard that has already been created, navigate to that dashboard and click Edit. Note that only Personal Dashboards can be edited here. System Dashboards must be edited in Power Apps by a System Customizer user.

.
For detailed information on the Microsoft Dynamics 365 Relationship Assistant and the function it provides, we recommend going to this learning site.
If a component is the smallest width, then there won’t be an option to Decrease Width.
After moving the components and you are finished customizing the Dashboard, make sure to press Save in the upper left-hand corner before closing.
sharing personal dashboards
Before sharing a Personal Dashboard with other users, you should consider if you have included any Personal Views or any Personal Charts in your Dashboard. If your Dashboard includes Personal Views and/or Personal Charts, you need to share those components with the other users first in order for them to access them within the Dashboard. Steps for sharing Personal Views can be found in the Managing Views KA.
To share a Personal Dashboard with other users, navigate to your dashboard and click the Share icon in the top corner. Choose Manage Access:
Search for the user or team you would like to share this Dashboard with:
Select the user(s) or team(s). After selecting users/teams, they will appear under the Manage share access section:
Select the user(s) to manage permissions for your Personal Dashboard. You can do this for one user at a time if they will have different permissions, or you can select multiple users to set permissions in bulk:
Next, set the Permissions for the selected user(s).
Below is an overview of what each permission allows:
| Permission | What It Allows |
|---|---|
| Read | View the dashboard and its data. This is the minimum required to access a shared dashboard. Assign this if you just want someone to use the dashboard. |
| Write | Make changes to the dashboard layout or components (e.g., charts, views). Note they will be changing the dashboard for all users (including you!) |
| Delete | Permanently remove the dashboard. Use with caution. |
| Append | Attach related records to the dashboard (e.g., link a chart or view). |
| Append To | Allow the dashboard to be attached to other records. Often used with Append. |
| Assign | Transfer ownership of the dashboard to another user. Only give this permission if you intent to pass ownership. |
| Share | Share the dashboard with other users and assign them permissions. Only give this permission if you want them to share it onwards (for example you share it with one user and let that user share it with others or a whole team.) |
Select the permissions and click Share:
changing default dashboard for your user
If you would like to set your new dashboard as your Default dashboard, you can do so by navigating to your dashboard and clicking Set As Default:
This will change the Default Dashboard for your user only.